Quartic Regression Calculator
The quartic regression calculator applies a 4th-order polynomial model to a set of x-y data. A higher-order polynomial is suitable when your data is more complicated than a cubic or quadratic equation can handle.
Read on to learn about:
- What is the quartic regression formula?
- How to use this quartic regression calculator.
- What is the difference between linear and polynomial regression?
Quartic regression formula
The quartic regression formula is a 4th-order polynomial, similar to the standard quadratic equation, but the two additional terms: x3x3 and x4x4. Here is the general quartic formula:
Different complex lines with two turning points can be generated by changing the values a0a0 through to a4a4, an example of which is shown below.
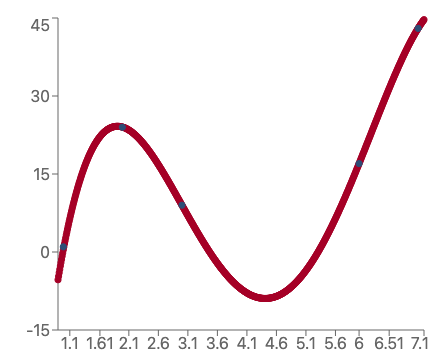
To obtain the values of these coefficients, an algorithm minimizes the difference between each data point's y-value and the y-value given by the quartic formula.
How well a quartic model fits your data is determined by all the errors between the model and the data and is called R2: For a perfect fit, R2 is equal to 1.
For more on the math behind quartic regression, please check out the polynomial regression calculator.
How to use the quartic regression calculator
To get a quartic regression model for your dataset, type in the x and y coordinates of each point into the calculator. You will need to enter at least 5 data points, and the calculator can accept a maximum of 30 data points (x, y pairs).
The results section gives you all the coefficients of the quartic equation and how well the model fits the data.
You can use the precision dropdown menu of the calculator to change the precision of the coefficients.
Other regression calculators
Here are some other polynomial-based regression calculators that you might find useful:
FAQs
- What is a quartic function?
- A quartic function is a 4th-order polynomial consisting of five terms: y = a₄x⁴ + a₃x³ + a₂x² + a₁x + a₀ Such a function has three critical, or turning, points and four real roots (found at points where the function crosses the x-axis).
- What is the difference between linear and polynomial regression?
- In linear regression, we assume that the data best fit a straight line. Polynomial regression uses higher-order x-axis terms so that we can model more complex data. Generally, if you get a poor fit between data and model, try the next order of polynomial regression or another function (for example, the exponential function).
Related calculators
5★ rating average
The rating average calculator returns an average rating based on the number of 1-5 ratings.
Statistics
Dice probability
With this dice probability calculator, you can easily find the various probabilities related to rolling a set of dice.
Statistics
Critical value
The critical value calculator helps you find the one- and two-tailed critical values for the most widespread statistical tests.
Statistics
Coin flip probability
Coin flip probability calculator lets you calculate the likelihood of obtaining a set number of heads when flipping a coin multiple times.
Statistics